Monitoring Internet speed with macOS Monterey and Telegraf
Seemingly undocumented, macOS Monterey comes with a new tool called networkQuality that can be used to measure Internet connectivity quality and speed.
Show me!
The tool will measure several aspects of your Internet connectivity and provides several measurements useful to understand overall performance. By default, the output is human-readable. Here’s what it looks like on a Comcast 1G/40M plan:
tim@snork:~ $ networkQuality -s
:=== SUMMARY:=== Upload capacity: 36.633 Mbps Download capacity: 865.296 Mbps Upload flows: 16 Download flows: 12 Upload Responsiveness: High (1250 RPM) Download Responsiveness: High (1818 RPM)
Output, explained
“flows” can be thought of as threads; a single TCP connection is unlikely going to saturate high-bandwidth links, so multiple flows are created until the network link is fully saturated and measuring as close to maximum speed as possible.
“RPM” is an Apple creation that provides an easy-to-understand metric ranging from 50 (poor) to 3,000 (excellent) where larger numbers are simply better instead of trying to convey usability in milliseconds with considerations for bufferbloat.
Notice in the above example, the -s flag is passed. This tells the tool to perform the upload and download tests sequentially. By default, tests are run in parallel. While running the tests in parallel will provide more data points, my Internet service is asymmetrical and therefore I want to test the upload independently of the download; it’s also easier to spot issues like upstream congestion if the tests are discrete.
Fun facts
When networkQuality is run, it fetches a manifest with locations of the data files downloaded and uploaded. It also will choose an endpoint closest to your location (e.g., in Chicago, I’m sent to uschi5-edge-bx-016.aaplimg.com which is a quick 9ms away). This process is much faster than other speed test tools that use other methods (e.g., ping) to determine which server is closest. I suspect Apple’s CDN is going to be more consistently performant than SpeedTest.net; I view it as similar to Netflix’s Fast.com speed testing project.
Note: If you use a VPN, be careful: this tool may very well select an endpoint closest to your VPN’s egress, not your local computer.
You can host your own backend instance and instruct the networkQuality application to fetch a custom manifest, so this tool could very easily be used to test internal network endpoints such as performance across a private WAN.
Monitoring and alerting
Running this test only when a problem is suspected isn’t necessarily helpful; sure, it’ll help isolate a slow down, but I’d rather keep an eye on performance over time.
Fortunately, the networkQuality tool offers computer-readable (a.k.a. JSON) output so that the results can be programmatically stored in a database.
Here are the fields of interest that you’ll find in its JSON output:
- Upload capacity expressed in Mbps (
ul_throughput) - Download capacity expressed in Mbps (
dl_throughput) - Upload flows (
ul_flows) - Download flows (
dl_flows) - Upload responsiveness in RPM (
ul_responsiveness) - Download responsiveness in RPM (
dl_responsiveness)
Tying it together
I use Telegraf to ship metrics into InfluxDB. For this example, I’m sending the metrics into InfluxDB Cloud, a fully-hosted time-series database, visualization platform, and alerting system.
Telegraf
There are numerous ways to configure Telegraf. For this example, I’m going to break it into three pieces: the agent configuration (telegraf itself), the output configuration (InfluxDB Cloud), and the input configuration (the speed test results).
Because I only want to run this every 30 minutes, I have a custom agent configuration that looks like this:
[agent]
  interval: "30m"
  round_interval: true
Experienced Telegraf users will say “you should tune your flush_interval!” among other things. That is true, but for this example I’m stripping it down to an MVP.
Now we’ll define the output:
[[outputs.influxdb_v2]]
  content_encoding: "gzip"
  urls: ["https://us-west-2-1.aws.cloud2.influxdata.com"]
  token: "your token here"
  organization: "your@org.here"
  bucket: "speedtest"
This, too, is really straightforward. If you’re working with InfluxDB Cloud for the first time, here are some docs that will help you figure out what values to place in each configuration statement:
- Viewing your organization
- Creating a bucket: I called mine “speedtest”
- Creating a token: I limited mine to write-only access to the “speedtest” bucket.
Finally, an input plugin — exec — that will run the command and expect JSON output. Once Telegraf receives the command’s output, it’ll send it off to InfluxDB Cloud.
If you’re curious about the exec plugin, my colleague wrote a great article about it. Check that out first if you’re not familiar or want more details on what’s happening under the hood.
[[inputs.exec]]
commands: ["/usr/bin/networkQuality -sc"]
timeout: "120s"
data_format: "json"
Visualization and alerting
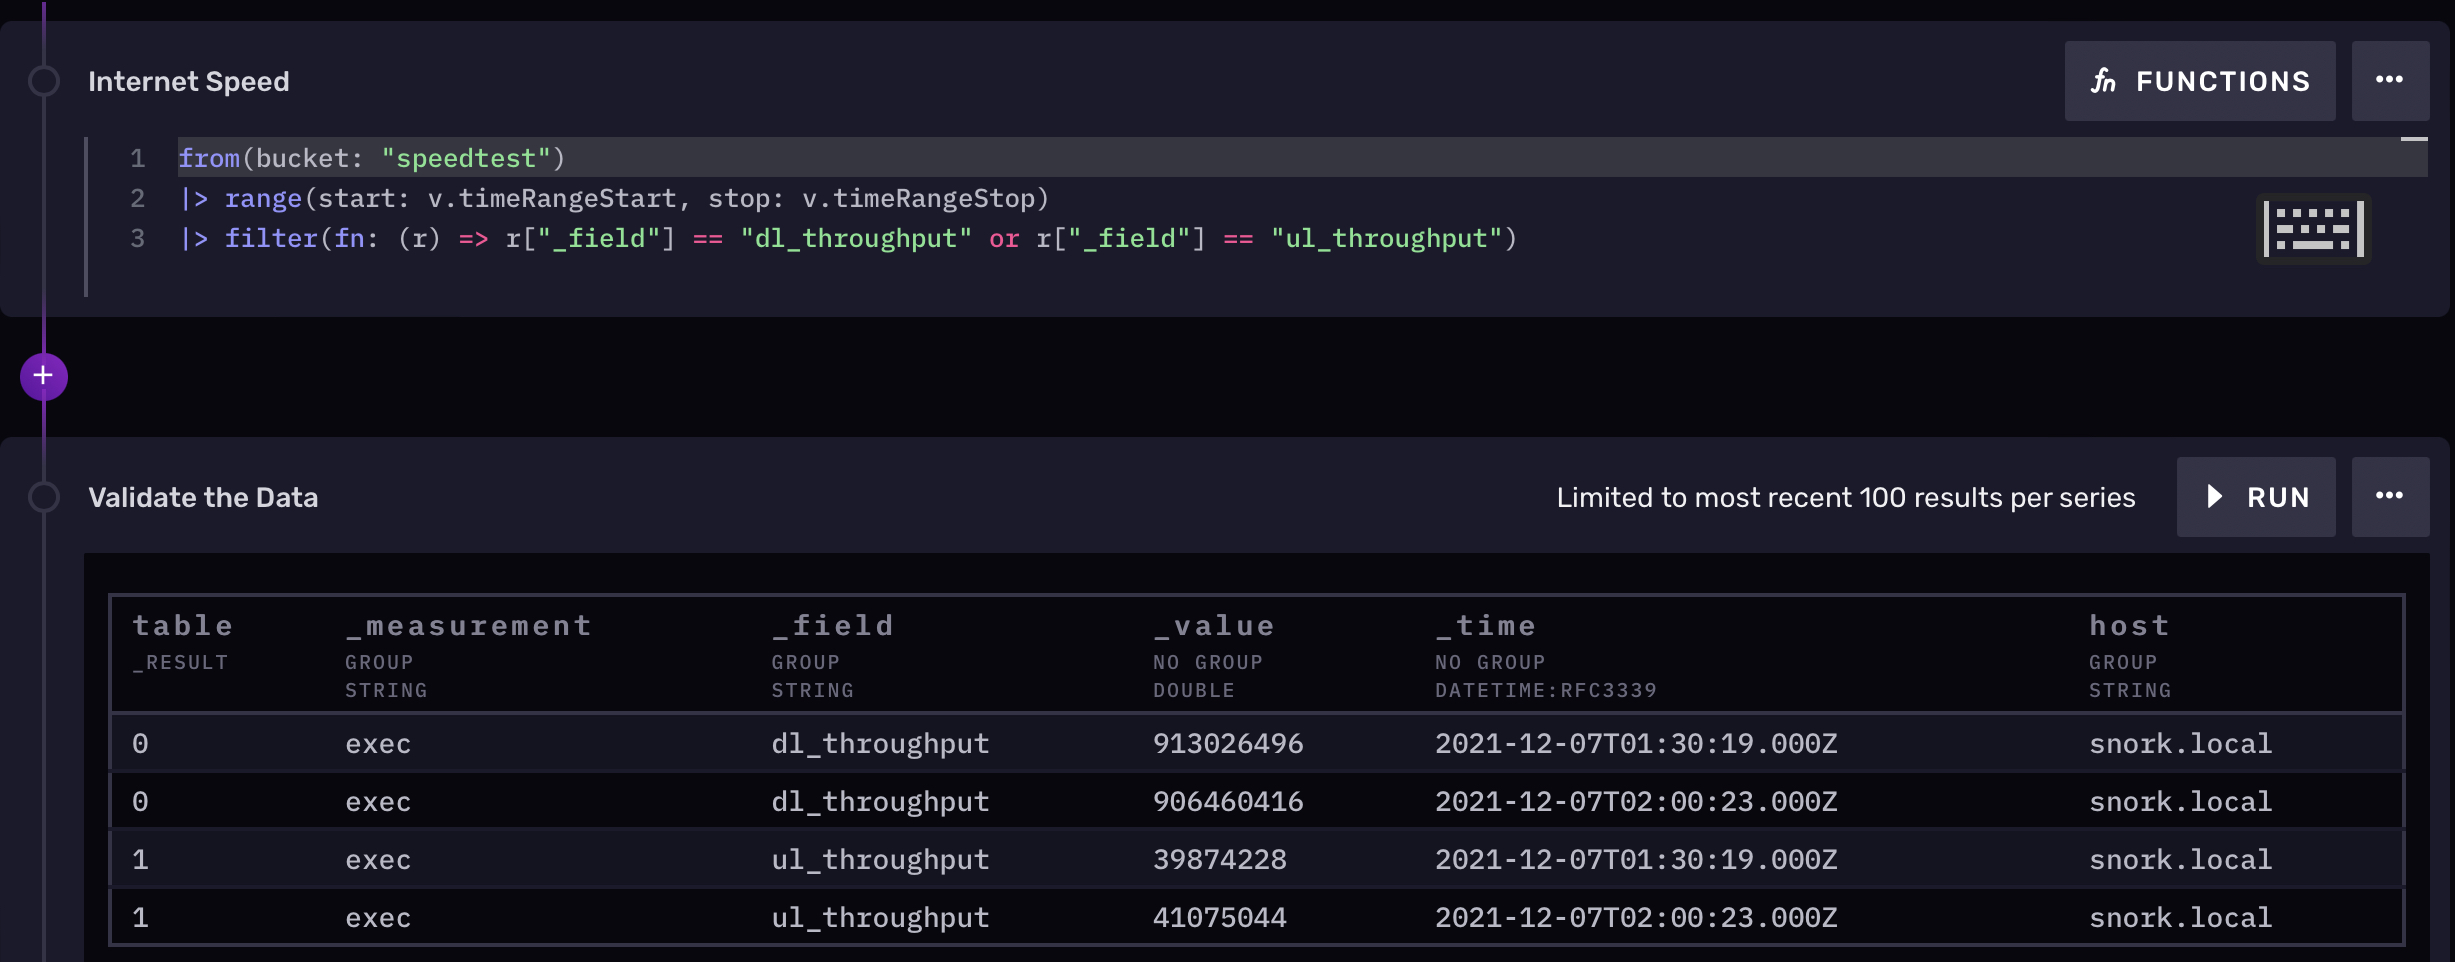
Over on InfluxDB Cloud, I can now locate the data I’m sending in within the “speedtest” bucket. I’ll use the new Notebooks functionality to examine the data, ensure it’s correct, visualize it, and finally create an alert. It follows a waterfall process — each step is connected to the previous and can be done in one screen:
Here’s my Flux query to pull the data, followed by the output that shows the last four runs of the program:
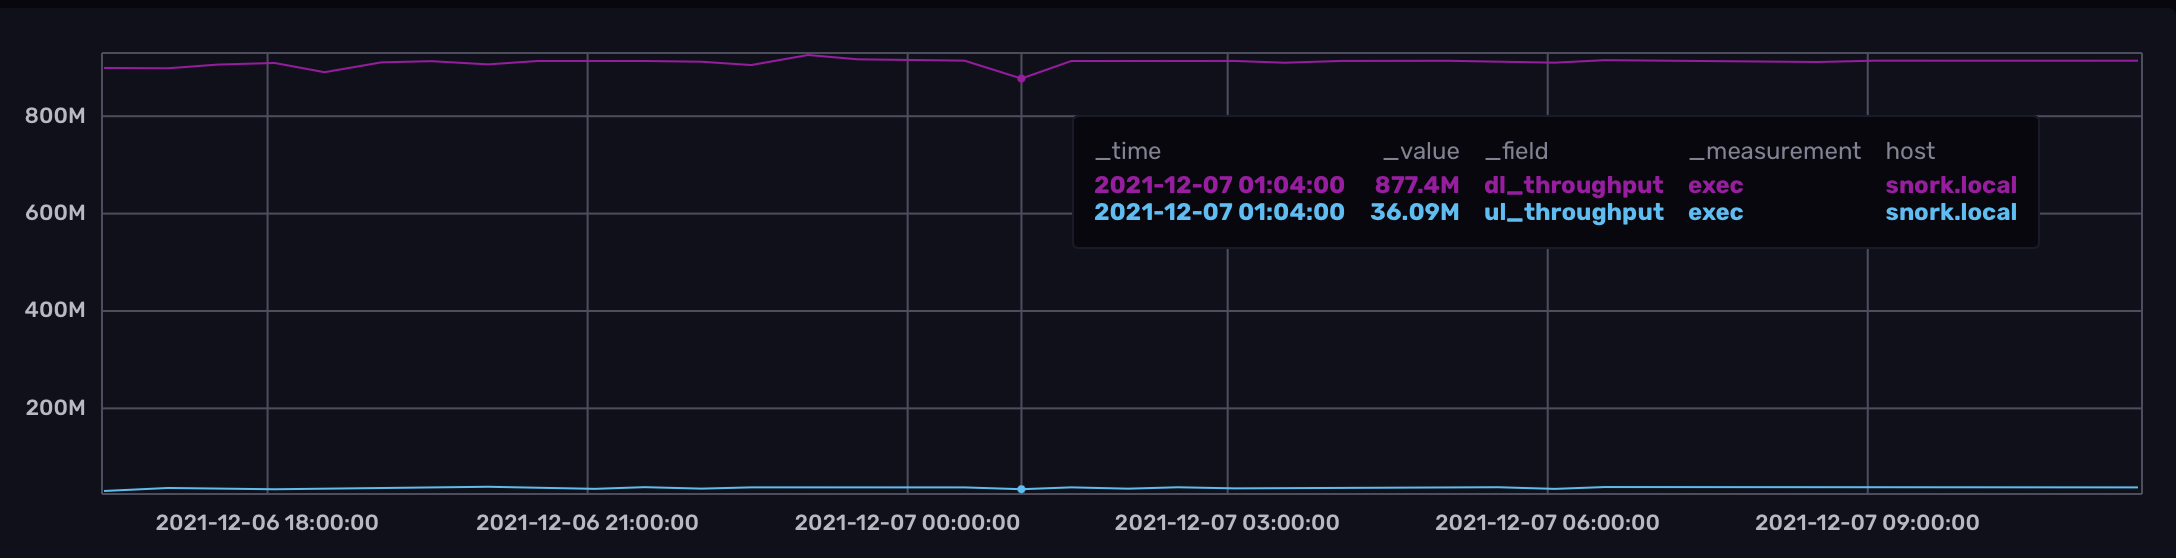
Next, a graph. You can see where there’s a little drop in performance, but otherwise the network appears to be consistently performant:
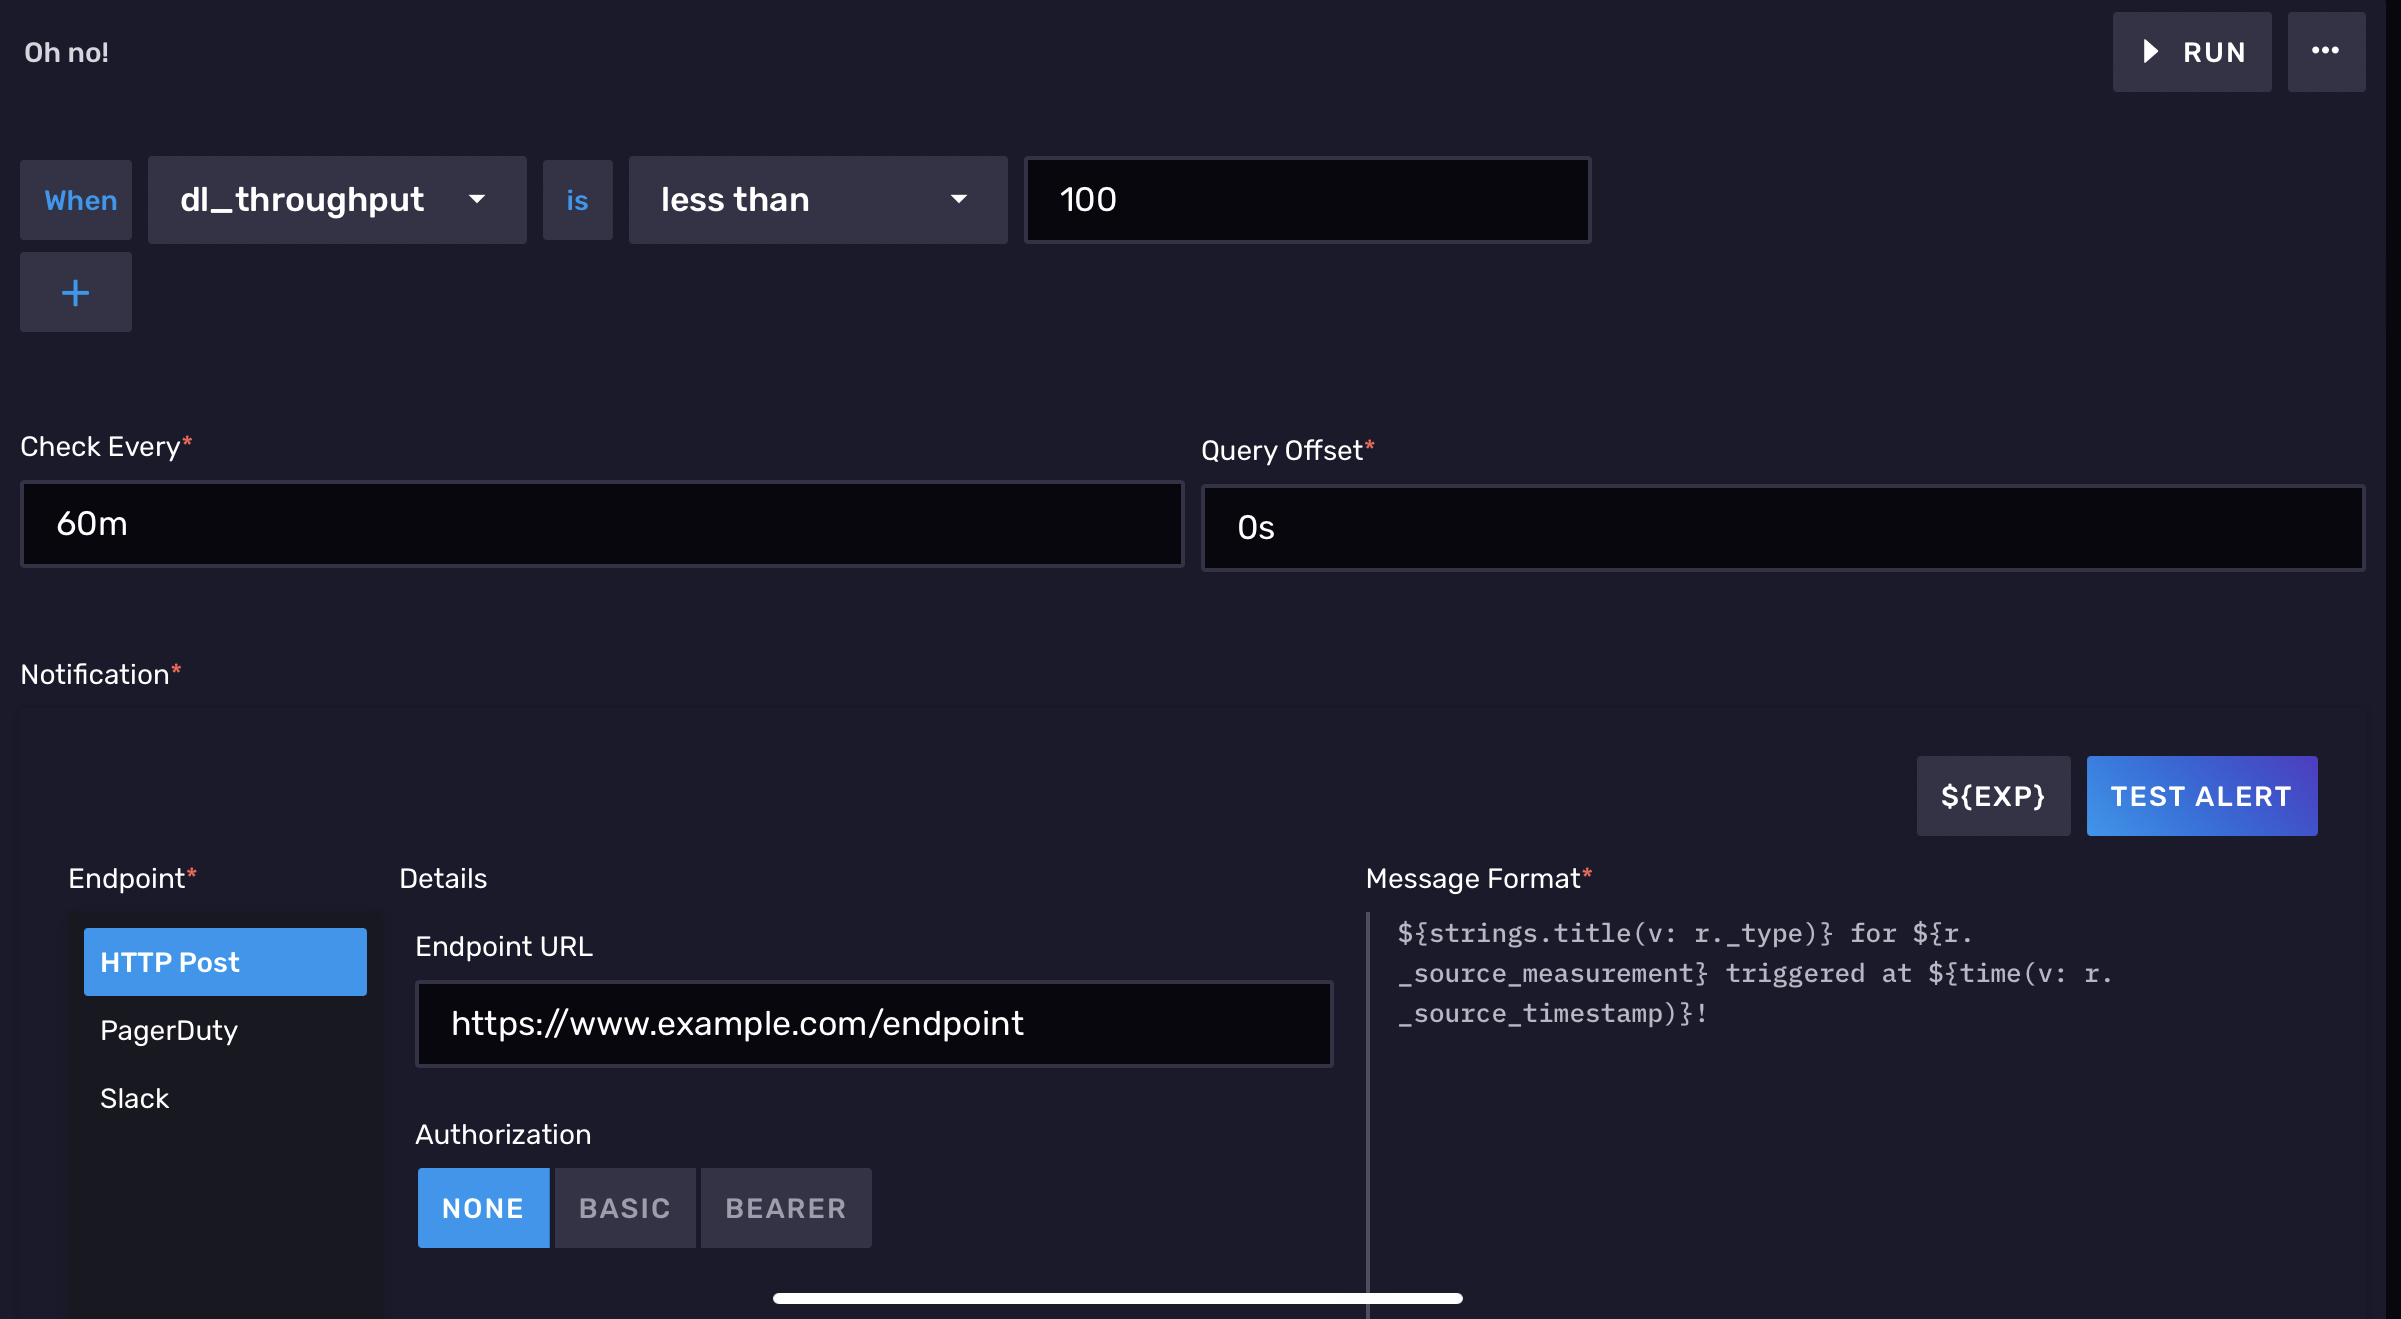
Finally, we’ll create an alert to let us know if our download bandwidth goes below 100Mbps:
That’s it!
I hope this has been a useful guide. If you have any questions, I can be found on the InfluxDB community slack. See you around!